
U.S. inflation surprised to the upside on November 10, 2026, sending Treasury yields sharply higher and putting renewed pressure on the Nasdaq. October’s Consumer Price Index rose 0.4% from September, against a 0.3% consensus, while core CPI gained 0.3% instead of the 0.2% economists expected. The repricing was unusually visible in government bonds: the two-year yield reached 4.736% and the 10-year yield stood at 4.996% on charts captured at 2:01 p.m. Eastern Time. The benchmark 10-year yield had briefly crossed 5%.
That combination matters beyond one difficult trading day. A stronger inflation reading increases the chance that the Federal Reserve will keep monetary conditions restrictive, or raise its policy rate again. Higher borrowing costs also challenge the valuations of technology companies whose investment cases depend heavily on cash flows expected years into the future. The latest move adds to the volatility described in our earlier preview of the October CPI release and Nasdaq risks. This report examines the actual data, the rate shock, the Treasury auction and the implications for U.S. equities.
October CPI: inflation slows from September but beats forecasts
The Bureau of Labor Statistics’ October report, released at 8:30 a.m. Eastern on November 10, shows that headline prices increased 0.4% on a seasonally adjusted monthly basis. That was below September’s 0.6% rise, but it exceeded the 0.3% forecast in a Reuters survey. Core CPI, which removes food and energy, rose 0.3%, compared with a 0.2% estimate. Therefore, the headline surprise was not confined to volatile energy prices.
| October 2026 CPI measure | Reported | Consensus | Surprise |
|---|---|---|---|
| Headline CPI, month over month | +0.4% | +0.3% | +0.1 percentage point |
| Core CPI, month over month | +0.3% | +0.2% | +0.1 percentage point |
| Headline CPI, September | +0.6% | Not applicable | Prior-month comparison |
| Core CPI, September | +0.3% | Not applicable | Prior-month comparison |
Housing costs increased 0.3% and accounted for more than 30% of the overall monthly CPI rise, according to the BLS. Food prices gained 0.5%, including a 0.4% rise in groceries. Energy prices rose 0.7%, a marked slowdown from September’s 5.2% increase. The mix matters: weaker energy inflation offered some relief, but price pressures in shelter and several service categories remained significant.
There is no official October 2026 headline or core 12-month CPI rate. The BLS could not publish most year-over-year changes because the federal funding lapse in October 2025 prevented collection of the corresponding price observations. It would be misleading to calculate or label an unofficial annual rate as an agency release. September’s annual rate is a different reference period and should not be presented as October’s figure.
Two-year Treasury yield: the bond market prices a tougher Fed
The most direct market signal of changing policy expectations came from the short end of the Treasury curve. At 2:01 p.m. Eastern on November 10, the TradingView hourly series TVC:US02Y displayed a yield of 4.736%. The visible rally in yields began from roughly 4.55% earlier in the session, and the chart reached an intraday area near 4.76% before easing. Reuters separately reported a rise of approximately 19 basis points to around 4.74% during the U.S. session.
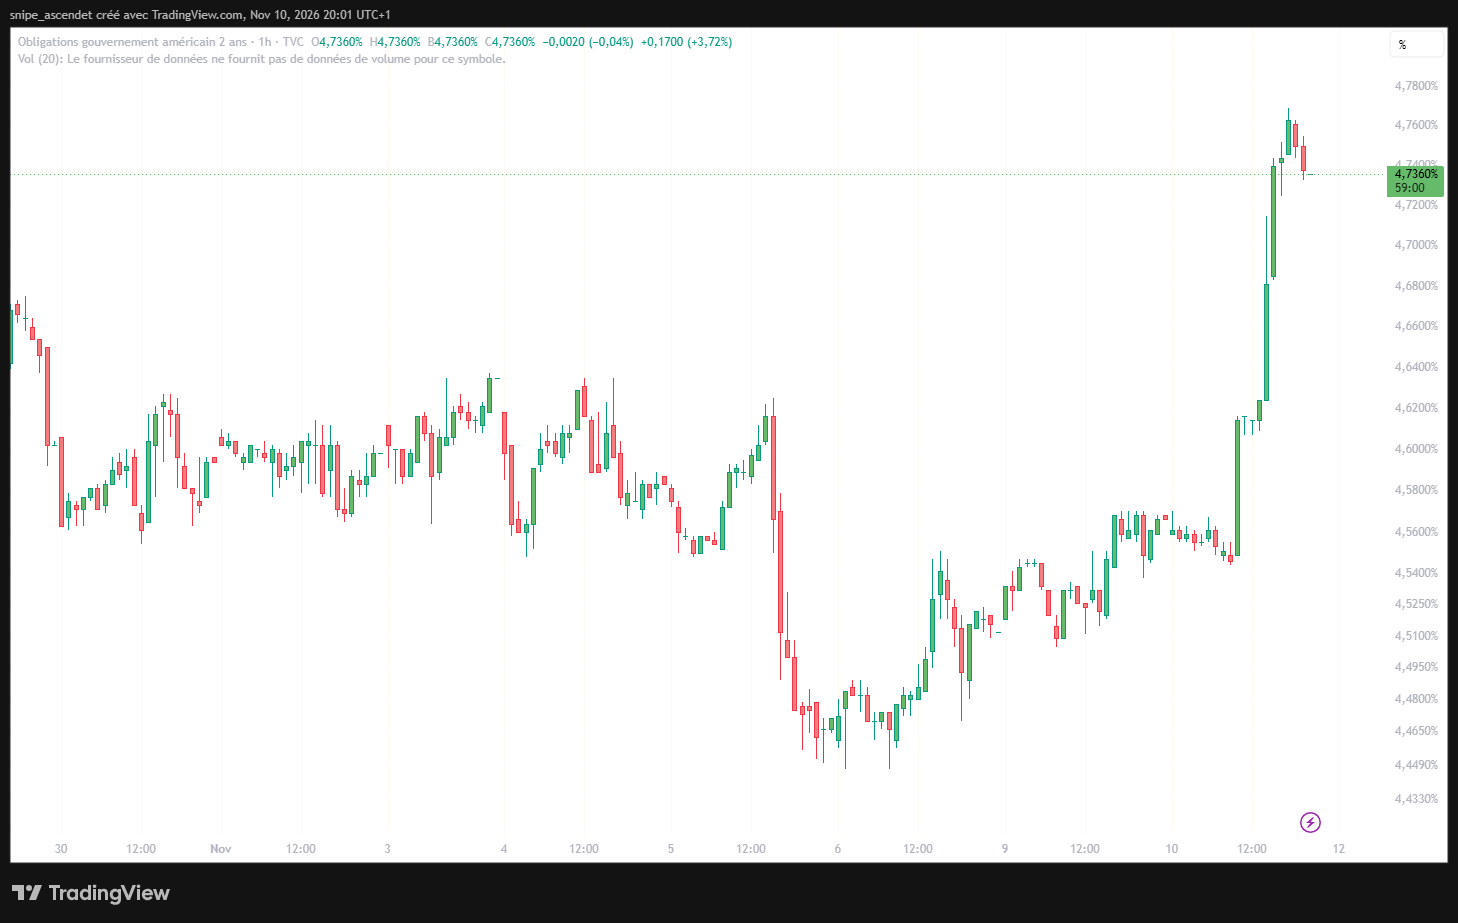
Two-year yields respond strongly to expectations for the Fed’s policy rate over the coming quarters. A rise does not mean the central bank has already tightened policy; it indicates that bond buyers demand more yield at current prices. Since bond prices and yields move inversely, the move also represents a decline in the market price of existing short-dated Treasury securities. Risk premiums, liquidity and positioning can contribute alongside monetary expectations.
The inflation surprise followed stronger-than-expected U.S. hiring data. The October employment report showed 165,000 jobs added and a 4.1% unemployment rate, developments examined in our analysis of employment and the Fed’s interest-rate dilemma. Stronger labor demand does not establish that wage growth is causing inflation, but it can give policymakers more room to concentrate on persistent price pressures.
Ten-year yield crosses 5% as the cost of capital rises
Long-term yields also moved decisively. The hourly TVC:US10Y chart showed 4.996% at the same 2:01 p.m. Eastern snapshot, after trading above 5.01% earlier. Reuters placed the benchmark near 4.988% at another intraday reference point. These differences reflect quote timing, not a disagreement about the direction of the selloff.
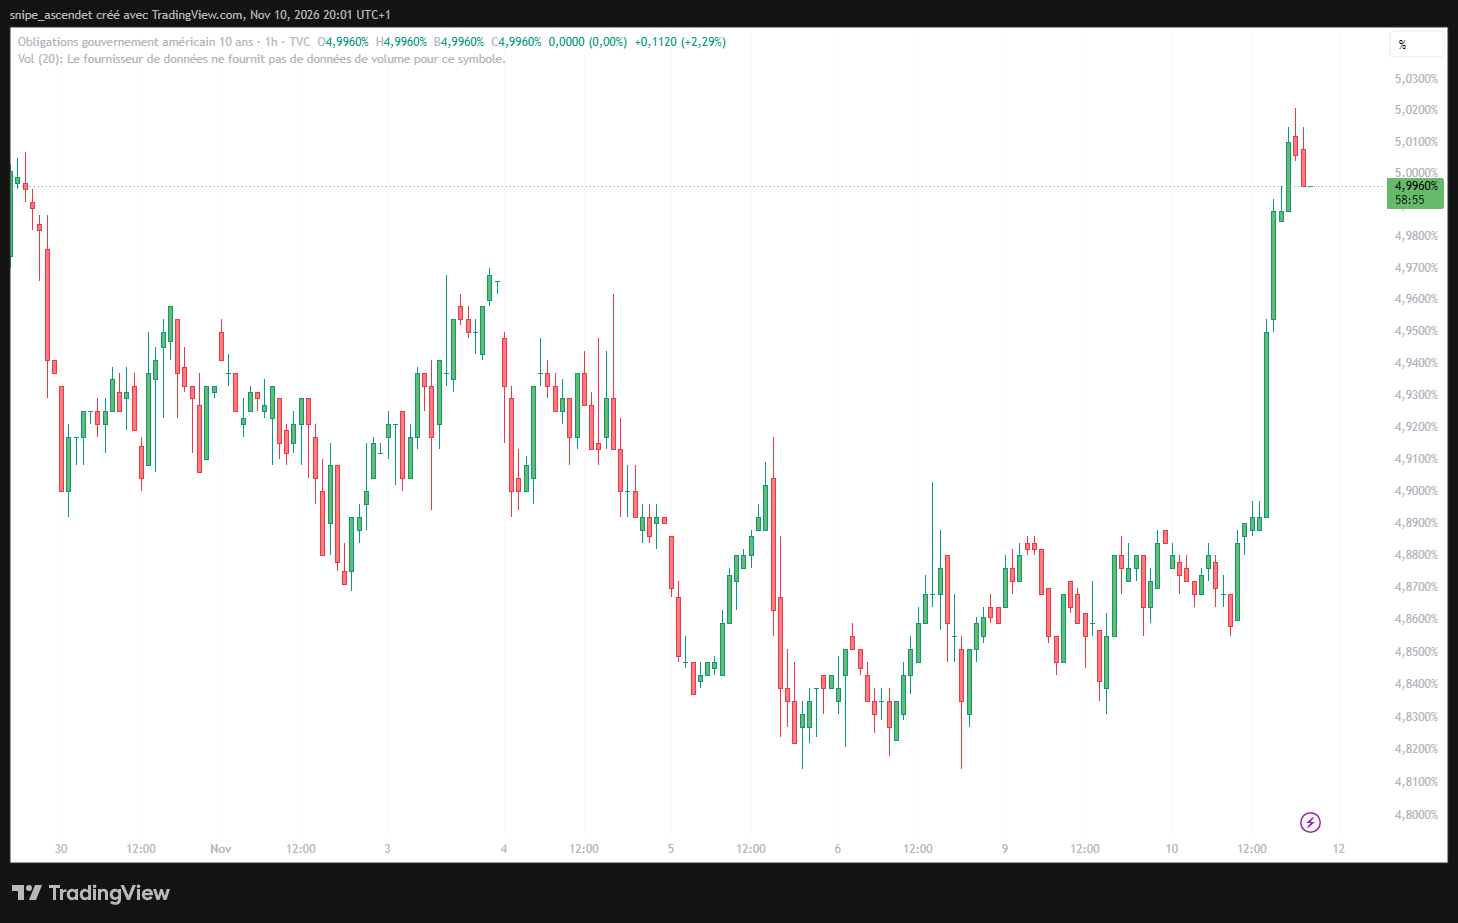
The ten-year yield reflects more than the path of the next few Fed decisions. Expected inflation, long-term economic growth, the supply of government debt and the extra compensation investors demand for holding longer maturities can all affect it. For households, companies and financial markets, sustained increases in long-term yields can feed into more expensive mortgages, loans and refinancing. A single session near 5% does not establish where rates will settle.
The $42 billion Treasury auction adds another test
The Treasury’s scheduled ten-year note auction took place at 1 p.m. Eastern on November 10. Its official auction results confirmed a $42 billion offering, a 5.020% high yield and a 2.46 bid-to-cover ratio. Investors submitted approximately $103.3 billion of recognized bids against the offering amount. The cover ratio was below the roughly 2.60 average of the previous six comparable auctions reported by the auction-data service TFTC, suggesting relatively softer bidding on that comparison alone.
The auction’s 5.020% stop-out yield should not be confused with the 4.996% secondary-market yield on the TradingView chart. One is the yield awarded in a specific government-debt sale; the other is a market quote that changes throughout the trading day. The difference is particularly relevant in a session when bond prices were moving rapidly.
Nasdaq and QQQ: why a higher discount rate hits growth stocks
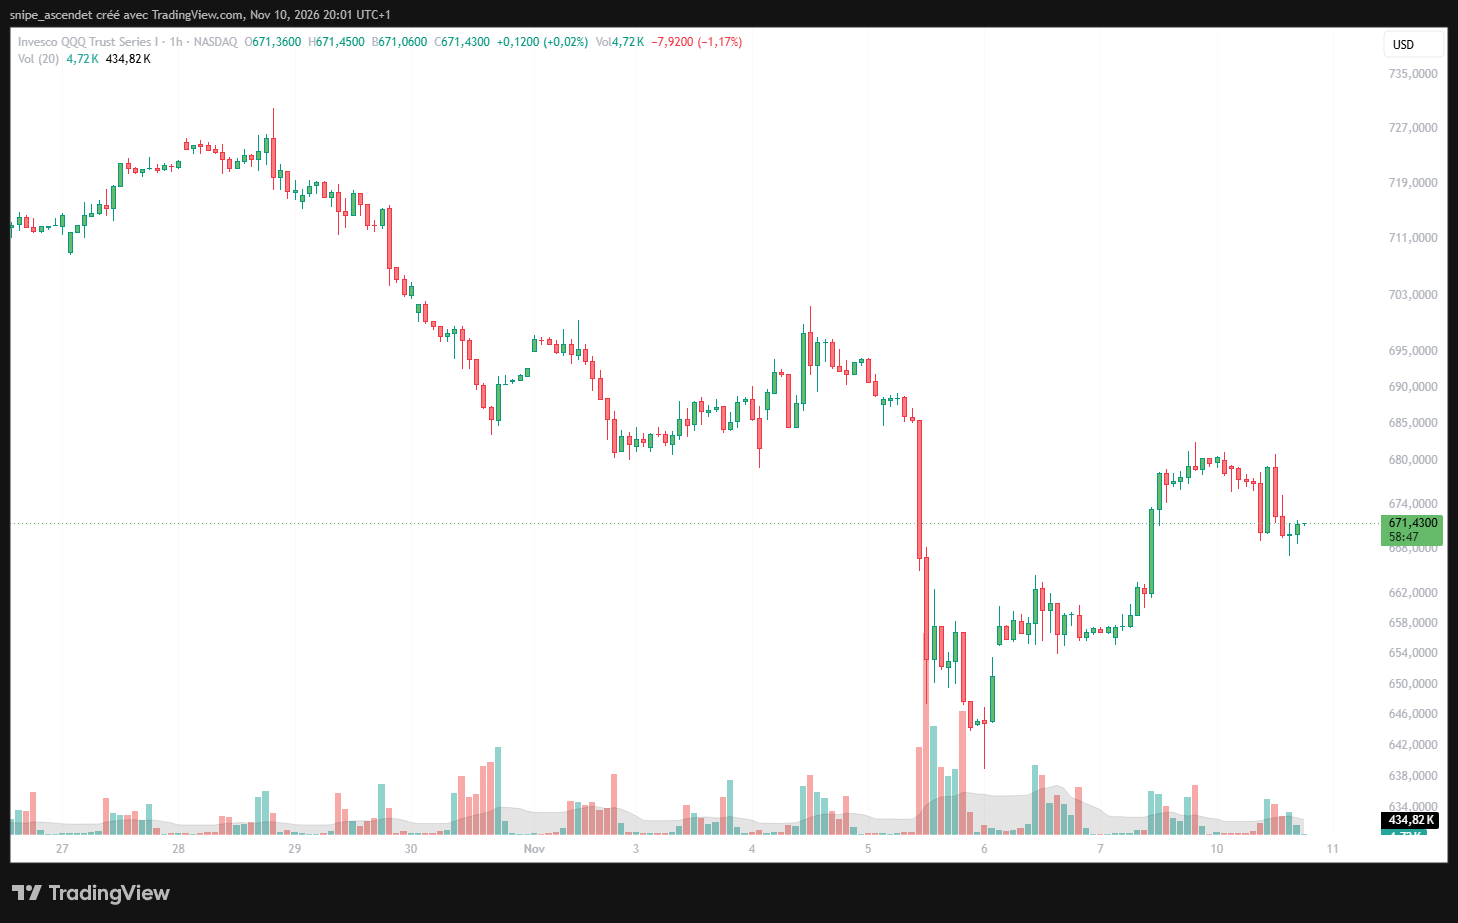
Technology shares felt the pressure even as the stock market tried to stabilize after last week’s selloff. Around the chart’s 2:01 p.m. Eastern reference, Invesco QQQ (NASDAQ:QQQ), the ETF tracking the Nasdaq-100, traded at approximately $671.43 on the hourly chart. The daily chart, captured around the same time but not at an identical tick, displayed approximately $671.33, down 1.18% for the session so far. Neither figure is a November 10 closing price.
The valuation mechanism is straightforward. The farther in the future a company’s expected profits or free cash flows lie, the more sensitive their present value can be to changes in the discount rate. Rising Treasury yields lift the reference rate used in many valuation models, potentially compressing price-to-earnings and cash-flow multiples even when analysts do not change their revenue forecasts. This is one reason high-growth companies and capital-intensive artificial-intelligence infrastructure providers can respond sharply to changes in rate expectations.
Yet inflation is not an adequate explanation for every technology-stock move. Investors are also reviewing the economics of AI data centers, electricity constraints, competitive dynamics and how quickly infrastructure investment will generate cash. Those concerns were central to the November 5 semiconductor selloff. The inflation report introduces an additional financing and valuation headwind rather than replacing company-specific risks.
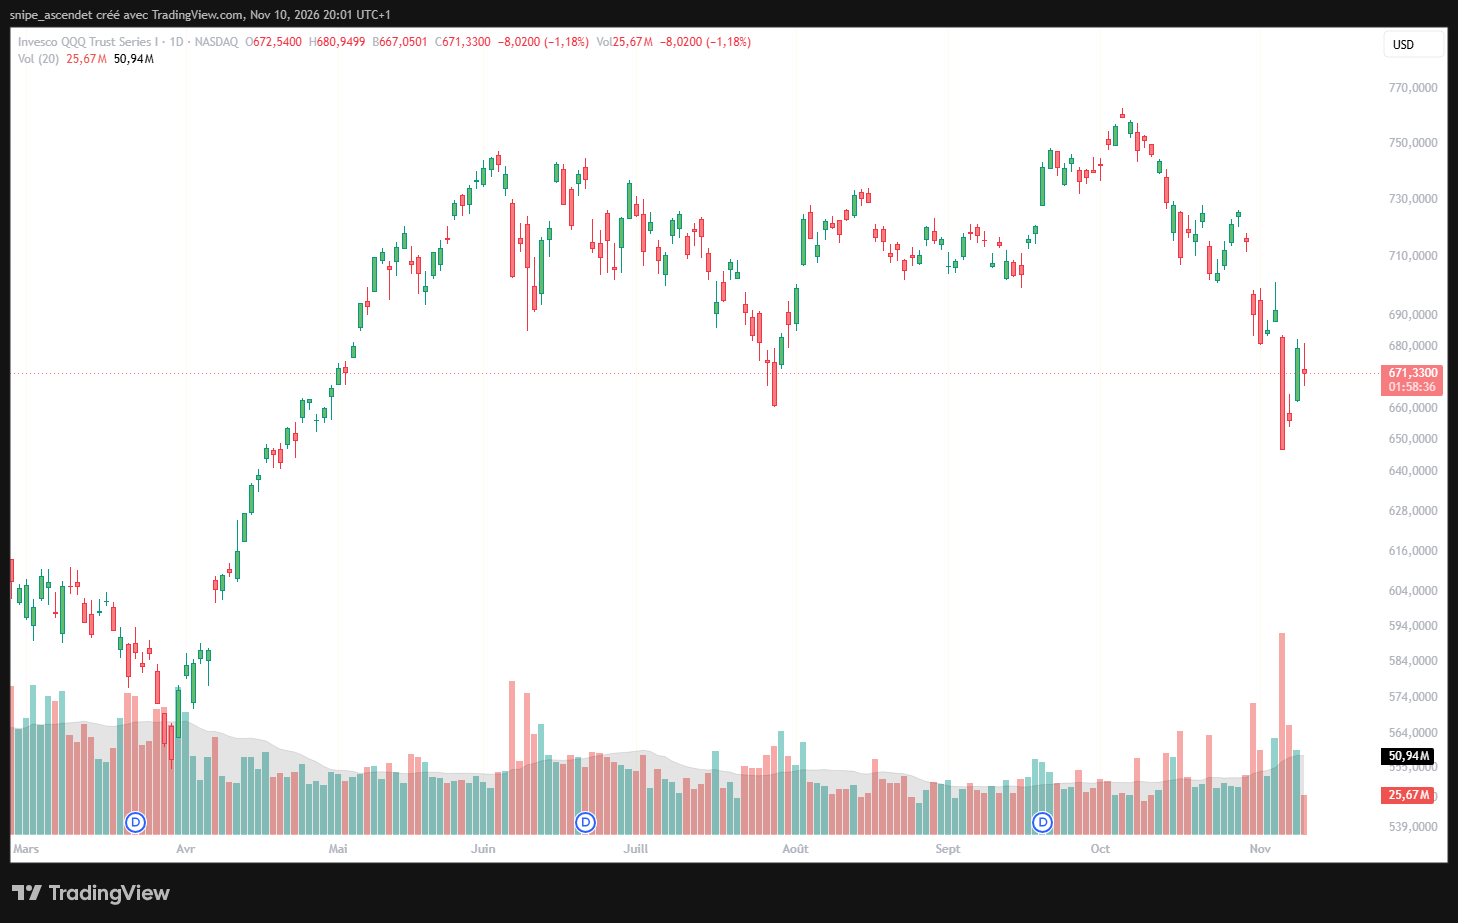
The daily QQQ view places the latest decline in context: the ETF is well below its early-October high after sharp selling in early November and a partial rebound. The large volume spikes visible around the selloff help establish that trading activity increased, but they do not identify who sold or why. The current day’s displayed volume is incomplete and must not be compared with a full-session average as if trading had already ended. Our coverage of the November 6 rebound showed how quickly technology stocks could recover part of an earlier loss without ending the underlying volatility.
The S&P 500 declines too, but the technology gap matters
The weakness extended beyond the Nasdaq. SPDR S&P 500 ETF Trust (NYSE Arca:SPY) showed approximately $747.92, down 0.63% intraday on the daily screenshot. SPY is an exchange-traded fund tracking the S&P 500, not the index itself. Its lower percentage loss than QQQ in these captured quotes is consistent with technology-heavy portfolios experiencing more pressure, although the funds differ in holdings and construction.
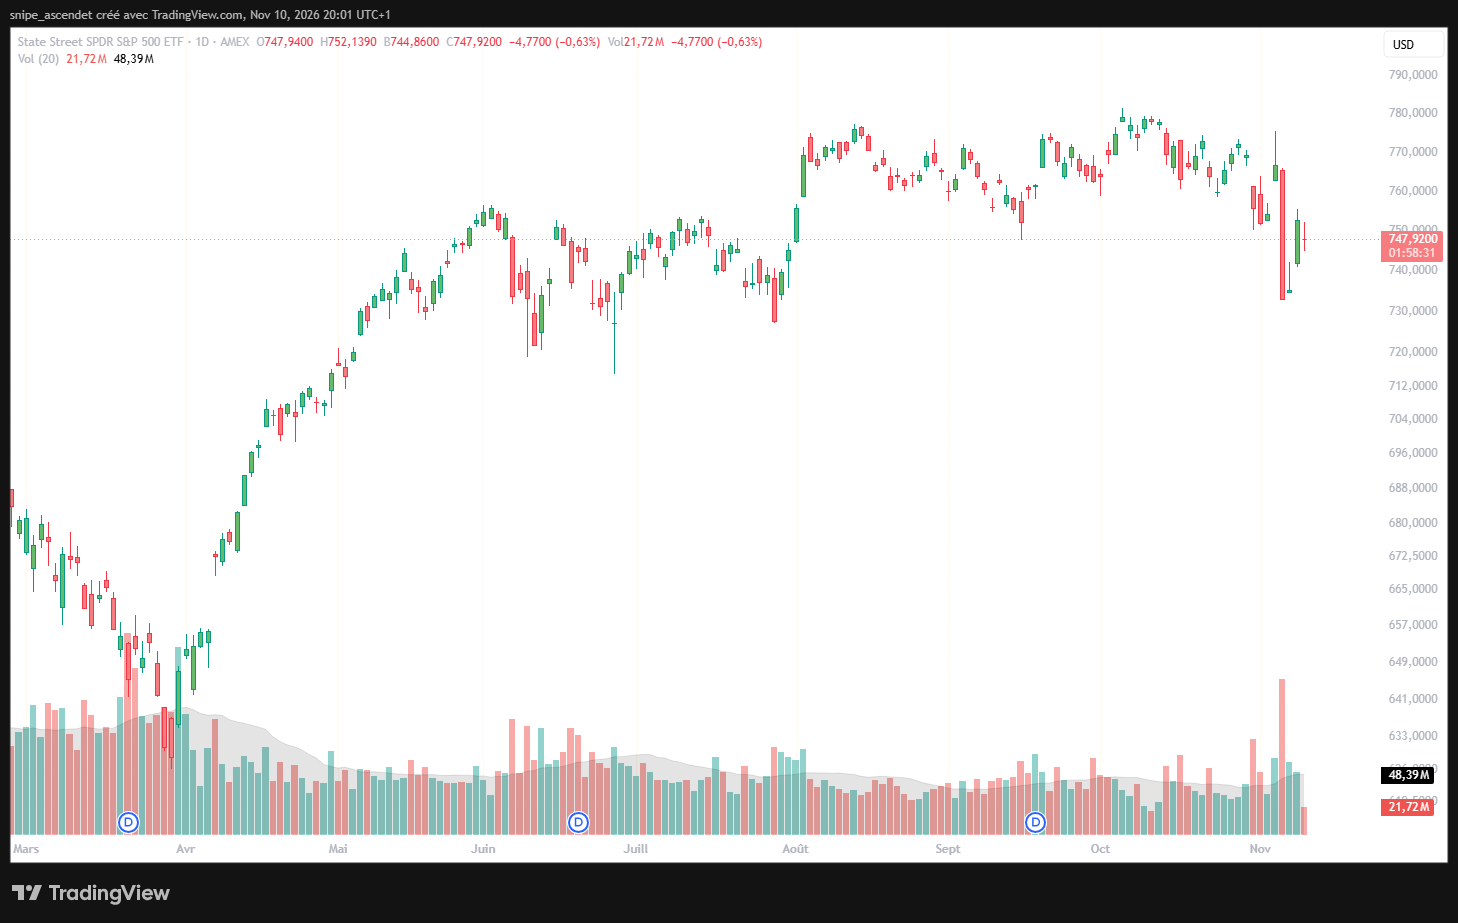
Broader equity weakness matters because the cost of capital affects more than speculative software stocks. Homebuilders, rate-sensitive consumer businesses and highly indebted companies can suffer when borrowing costs rise. At the same time, different companies may benefit from stronger nominal demand, resilient employment or higher interest income. Sector performance should therefore be evaluated alongside earnings power, leverage and exposure to financing markets, not by interest-rate sensitivity alone. French-language background on the drivers of long-term interest rates and economic cycles and asset classes provides useful conceptual context, though those articles do not report today’s U.S. session.
Could the Fed raise rates by 50 basis points in December?
Before the CPI release, Federal Reserve Governor Christopher Waller said in a November 10 speech in London that he was leaning toward a 25-basis-point rate increase at the December meeting. He also said that, if core CPI inflation came in around 0.3% or higher, the committee should consider a 50-basis-point rise. The published core reading was 0.3%, making the stated condition directly relevant to the debate.
That is an individual policymaker’s conditional view, not an announced Fed decision. The Federal Open Market Committee makes its decisions collectively. The target federal funds range currently stands at 3.75%-4.00%, according to the Federal Reserve. The next scheduled policy meeting is December 8-9, 2026. Market-implied probabilities can swing sharply between now and then, so a percentage quoted during a volatile session should not be treated as a fixed forecast.
The calendar creates a further complication. The BLS has scheduled November CPI data for December 10, the day after the Fed meeting. That means policymakers will not have the next monthly CPI release when they vote. Other labor-market, business and price data, together with financial conditions, will still inform the decision.
What happens next: three market scenarios
Scenario one: yields stabilize and tech shares find support
If the bond selloff loses momentum, the ten-year yield holds below its latest intraday highs and subsequent economic information points to cooling price pressures, growth-stock valuations could receive relief. This would not automatically validate every AI earnings forecast. Investors would still need evidence that substantial capital spending is producing sustainable revenue and free cash flow.
Scenario two: the ten-year yield stays above 5%
A more persistent move above 5%, accompanied by renewed gains in the two-year yield, would suggest continued pressure on discount rates and financing conditions. Companies dependent on external capital or on distant earnings could remain particularly vulnerable. Even strong operating results might struggle to offset lower valuation multiples.
Scenario three: prices remain sticky but growth slows
For the Fed, the most difficult mix would be stubborn inflation alongside weakening activity or hiring. In that case, policymakers would have less room to restrain prices without increasing economic risks. Bond yields and equities would not necessarily move in a simple opposite pattern; changing growth expectations could dominate parts of the curve.
Bottom line: the bond market, not just the Nasdaq, holds the key
The October CPI report was cooler than September’s headline figure but still above expectations in both headline and core measures. On November 10, that surprise coincided with a sharp rise in the two-year Treasury yield, a test of 5% at the ten-year maturity, and renewed selling in QQQ and SPY. The government auction added a second, independently measurable indicator of demand for long-term debt.
For investors tracking the next phase of the correction, the critical signals are whether short-term Treasury yields continue to price tighter Fed policy, whether long-term yields remain elevated, and whether corporate cash-flow forecasts hold up. The next Fed decision will determine the policy response; one inflation release and one trading session cannot settle the broader direction of the U.S. stock market.